

On-the-Job Healthcare Costs More

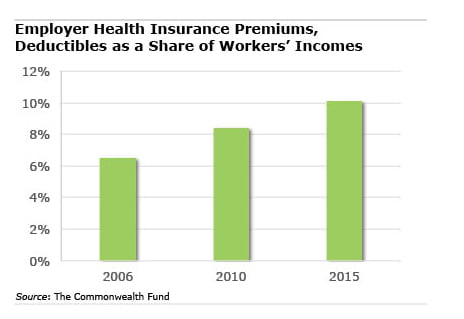 We’ve passed a milestone: workers typically spend more than 10 percent of their incomes for their employer health coverage.
A decade ago, they spent 6.5 percent on health costs.
One reason for the rising cost burden is the growing prevalence of high-deductible insurance plans, and, within these plans, the deductibles themselves are increasing. Although premium hikes in employer plans have slowed in the past five years, they are also still going up. The nation’s aging work force could be another indirect pressure on costs.
Workers’ incomes have also been going up, but growth remained sluggish over the past decade and “have not kept pace” with employer health costs, the Commonwealth Fund reported.
Healthcare news in recent weeks has focused on the 2017 premium hikes hitting people who buy coverage on the state exchanges created under the Affordable Care Act. But 154 million Americans – more than half of U.S. workers – obtain health insurance through their jobs, compared with about 10 million who go through the exchanges, points out the study by the Commonwealth Fund, a healthcare research organization.
When premiums and deductibles are combined, health costs are really starting to bite: the typical family shelled out about $6,422 in 2015 for premiums and copayments, compared with $3,531 in 2006 – that’s increasing much faster than the pace of inflation – the report estimated. No wonder one recent survey found only a minority of Americans satisfied with the cost of their health insurance plans.
In the Commonwealth Fund’s state-by-state analysis, the level of incomes in a state seem to play a role in the weight of workers’ healthcare burdens. For example, premiums and deductibles, as a share of workers’ incomes, currently exceed 12 percent in low-wage states like Arizona, Florida, New Mexico, Oklahoma, and Tennessee – Mississippi’s, the highest, is close to 15 percent of incomes. Workers in relatively well-off states such as Maryland, Massachusetts, and Washington, however, pay 7.9 percent, 7.3 percent and 8.5 percent of their higher incomes, respectively.
To examine the study’s state-by-state analysis, click here.
Squared Away writer Kim Blanton invites you to follow us on Twitter @SquaredAwayBC. To stay current on our Squared Away blog, we invite you to join our free email list. You’ll receive just one email each week – with links to the two new posts for that week – when you sign up here.
Comments are closed.


![iStock-910619648 [Converted]](https://crr.bc.edu/wp-content/uploads/2023/04/iStock-910619648-Converted-640x454.png.webp)
How many with HDHPs in larger employers have HSAs?
Nearly all. And most employers contribute to HSAs leaving insureds with a smaller burden.
Two things are troubling… smaller employers don’t sponsor HSAs and like individuals have to find one for themselves.
I failed to mention that HDHPs foster lower utilization of doctor’s office visits and superscription drugs that help employers but damage the health of employees.
When my son’s firm was taken over by a competitor in July, the premium for the family plan jumped 200%. More employees, Aetna plan with a “family friendly” employer. Go figure!
I thought one reason for flat wage growth trends is the crowd out impact to employers of increased health plan costs. It would be interesting to see data on trend of wages + welfare benefit spending.
I’ve encouraged employer clients to provide annual benefit statements showing total costs incurred by the employer, including employer paid health insurance, worker’s comp and employer payroll tax (FICA) obligations.
Rank-and-file employees are often unaware of the true cost of their employment. Seeing all the numbers adds perspective to the issue of wage growth.
There have been studies of low wage employees who, offered the choice of a pay increase or insurance benefits, often just want the money.
Dear Dave – that’s a great question, and I’ll keep my eyes out for some research on that specific question.
Here’s a study looking at the whole employer compensation package and the impact of rising health care costs, however:
http://squaredawayblog.bc.edu/squared-away/rising-health-costs-a-factor-in-inequality/
Thank you everyone for your comments, as usual!
Kim (blog writer)
From 6.5 percent to 10 percent, there is a big difference. This was something to think about.
Look at BLS historical comparison, employer cost for employee compensation, see:
http://www.bls.gov/news.release/ecec.toc.htm
What you will see is that over a 20 or so year period of study, the cost of health coverage as a percentage of total rewards has increased from about 6% of total rewards to over 8% of total rewards, while at the same time, direct compensation (salary, etc.) has declined from about 70% of total rewards to only 68% of so of total rewards – even greater change for public employees.
Similarly, while I can appreciate the nominal dollar change in terms of the deductible amounts, Americans pay only about 11% of the cost of health services out of pocket, dramatically less than the 30+% of medical expenses they used to pay out of pocket. So, no surprise in your results except maybe, that health coverage costs are not an even greater percentage of total rewards.
Thanks. However, Americans’ out of pocket health care costs are still much closer to historic lows than they are to historic highs – as measured as a percentage of the cost of all health services.
Consider National Health Expenditure Data by Source of Funds (hopefully the formatting works here):
Expenditure Amount (Billions)
So, 50 years ago, Americans paid 40% of the cost of medical services out of pocket, while today, it is just about 11%.